Sharing Our Passion for Technology
& Continuous Learning

This blog provides a recap of our talk delivered at the Iowa Technology Summit, and DevOpsDays Des Moines, and the Midwest Global AI Developer Days conferences.
We are publishing a three-part blog series that is a distillation of that talk; Intro to the Current State of AI/ML, Overcoming Challenges to Adoption, and Using AutoML.
About Us
Source Allies is an IT Consultancy founded in 2002 and driven by an Ownership Mindset. We’re Builders: Data Scientists, Engineers (Data, ML, Software, DevOps), Cloud Architects (AWS, Azure & GCP). We create innovative custom software products with our partners using the simplest architecture. Read more about our super-quants here and here.
Using AutoML
It is an exciting time to be interested in using AI/ML to innovate within your organization. The state of AI highlighted in Part 1 shows the rapid rate of advancement of AI, and how it’s fueled by cloud and hardware acceleration. Part 2 showed how the AI/ML community is overcoming challenges to AI/ML adoption. And in this final part, we put AutoML to the test by using SageMaker Canvas to compete in a predictive data science competition where over 2,500 ML engineers and data scientists competed for prize money. And the results may not be what you’d expect.
The Data Science Competition
To put AutoML to use, we decided to throw it's hat in the ring and compete with humans for $30k in prize money offered by Prudential Life Insurance in this Kaggle Competition. In the dataset provided by Prudential, competition participants are provided over a hundred variables describing attributes of life insurance applicants. The task is to predict the "Response" variable for each Id in the test set. "Response" is an ordinal measure of risk that has 8 levels. The risk level is important for an insurance company to understand to know how risky it is and how much potential liability is taken on.
Training Data
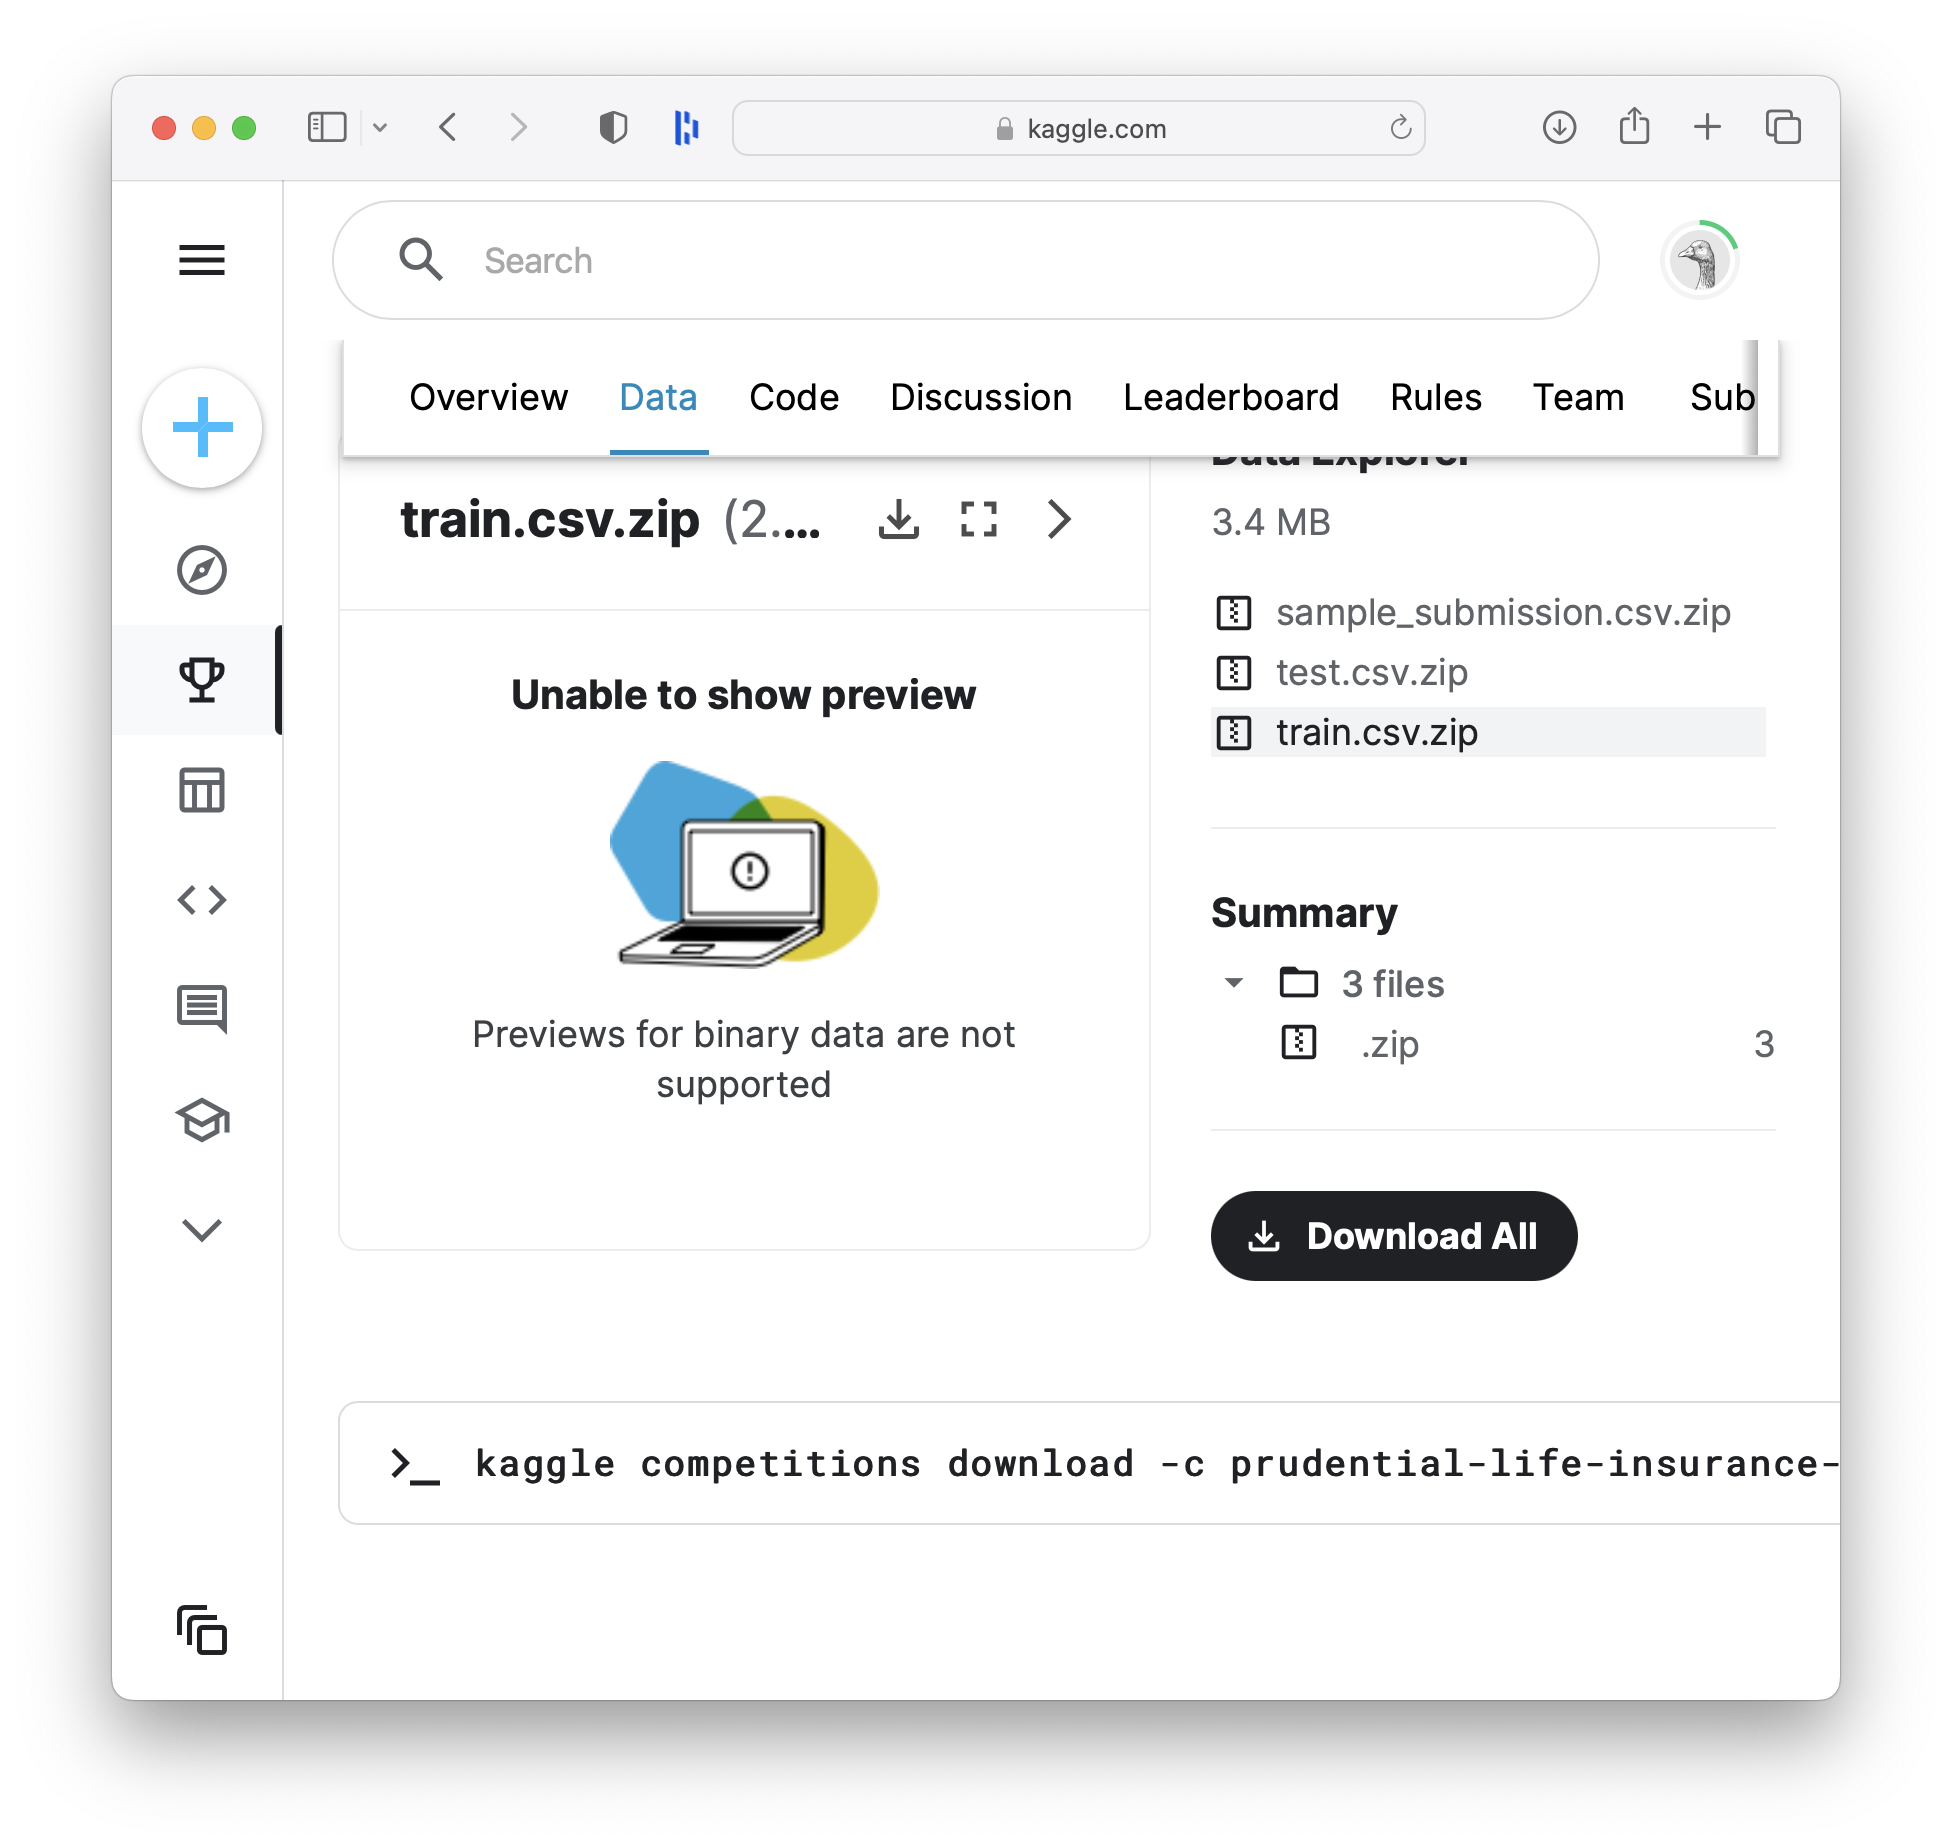
The Kaggle Competition provides participants with both training and test data.
- train.csv - the training set, contains the Response values
- test.csv - the test set, you must predict the Response variable for all rows in this file
- sample_submission.csv - a sample submission file in the correct format
To compete, we train a model with AutoML using train.csv. Then we'll feed the resulting model the test.csv data and submit our test predictions to Kaggle.
Launching Canvas
 So to get started with AWS SageMaker Canvas, we simply launch a Canvas app and upload our
 train.csv file. Then select the training set, click on "Create new model", and you'll be presented with some statistics on the values inside of each of the columns in the training data. These statistics are an important part of understanding the quality of the data you're going to use for prediction inputs.
Preparing Your Training Data
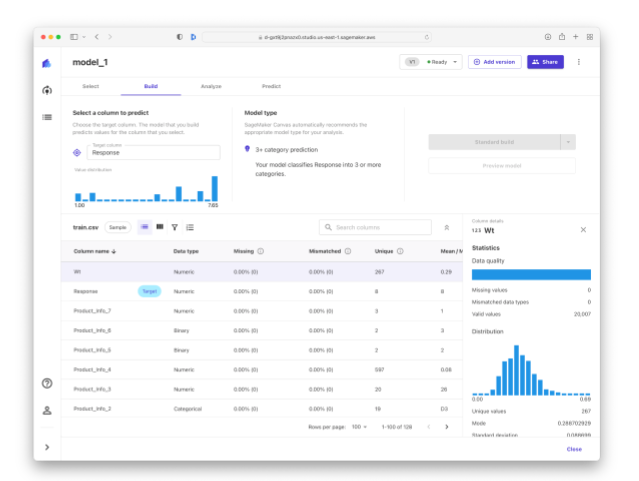
After you've loaded your training data, you can see that Canvas lets you preview, import and then analyze the data in each column, select a column to predict, select a model type, and start building a model to predict the target column!
While Canvas does a pretty good job of describing what the user needs to select in order to launch the AutoML job in terms that are intuitive to a business/data analyst, it's still very helpful to collaborate with a data scientist on the model type. For example, we collaborated with a Source Allies data scientist and he advised using a numeric prediction, instead of the Canvas recommended multi-category prediction in order to reflect the numeric order of the risk ratings (for example risk rating of 5 means it's less risky than another applicant rated at 8).
Once the selections are made in Canvas, you can press "Standard build" to spin up some AutoML experimentation that will attempt to arrive at the best possible predictive model. This process can take up to a couple hours and the AWS costs to run the experiments range from $100 and $200.
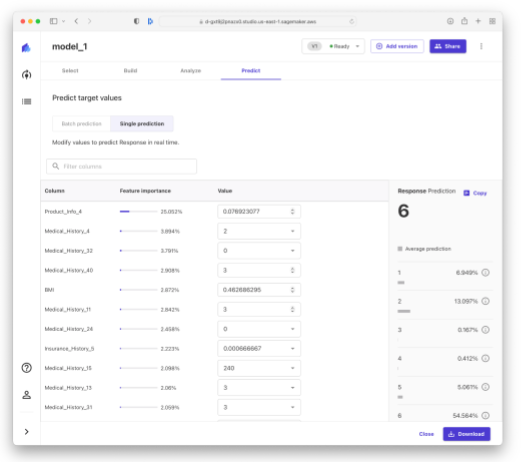
Once the AutoML experimentation is complete, you are presented with an Analyze tab that shows the model performance as well as some high level visualizations of feature importance (e.g. how important is the body mass index or BMI features when predicting the risk associated with life insurance applicants). What makes Canvas really stand out from other Guide Model Development tools on other platforms is the button called "Share with SageMaker Studio", that lets you share your model with a data scientist so that they can review it, and adjust it before giving a thumbs up that the model is ready to move towards production.
Reviewing the Model Explainability Reports and AutoML Ouput
This collaboration step is essential in our mind to practical use of Canvas and AutoML. Your data scientist is given fantastic explainability reports and can see all of the hundreds of steps that the Guided Model Development tooling went through in order to come up with the result. To give you a glimpse into what this process looks like, we asked a Source Allies data scientist to review the AutoML output (e.g. the output of SageMaker AutoPilot that SageMaker Canvas kicked off behind the scenes). You can see the analysis in the 4.5 minute video above.
Other Cloud Platforms
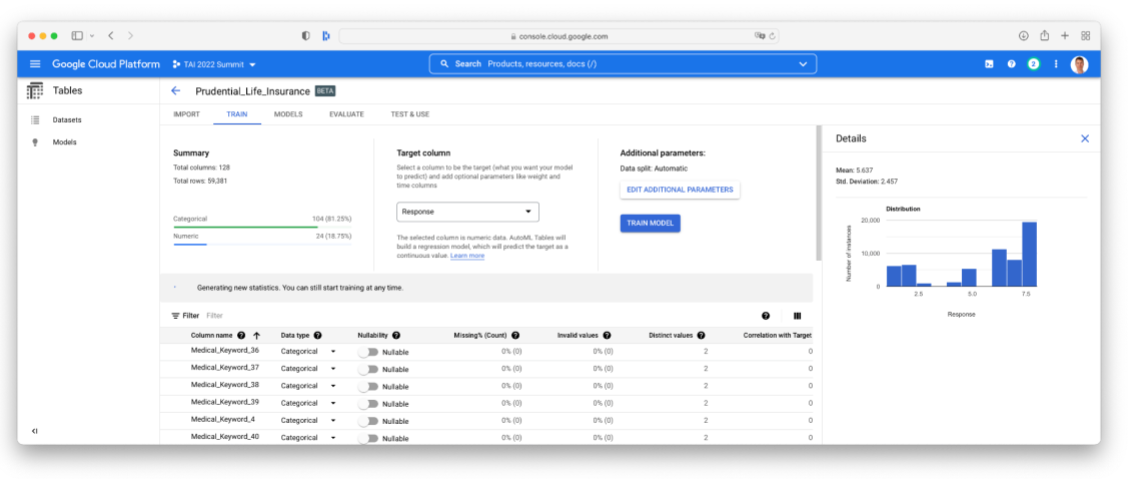
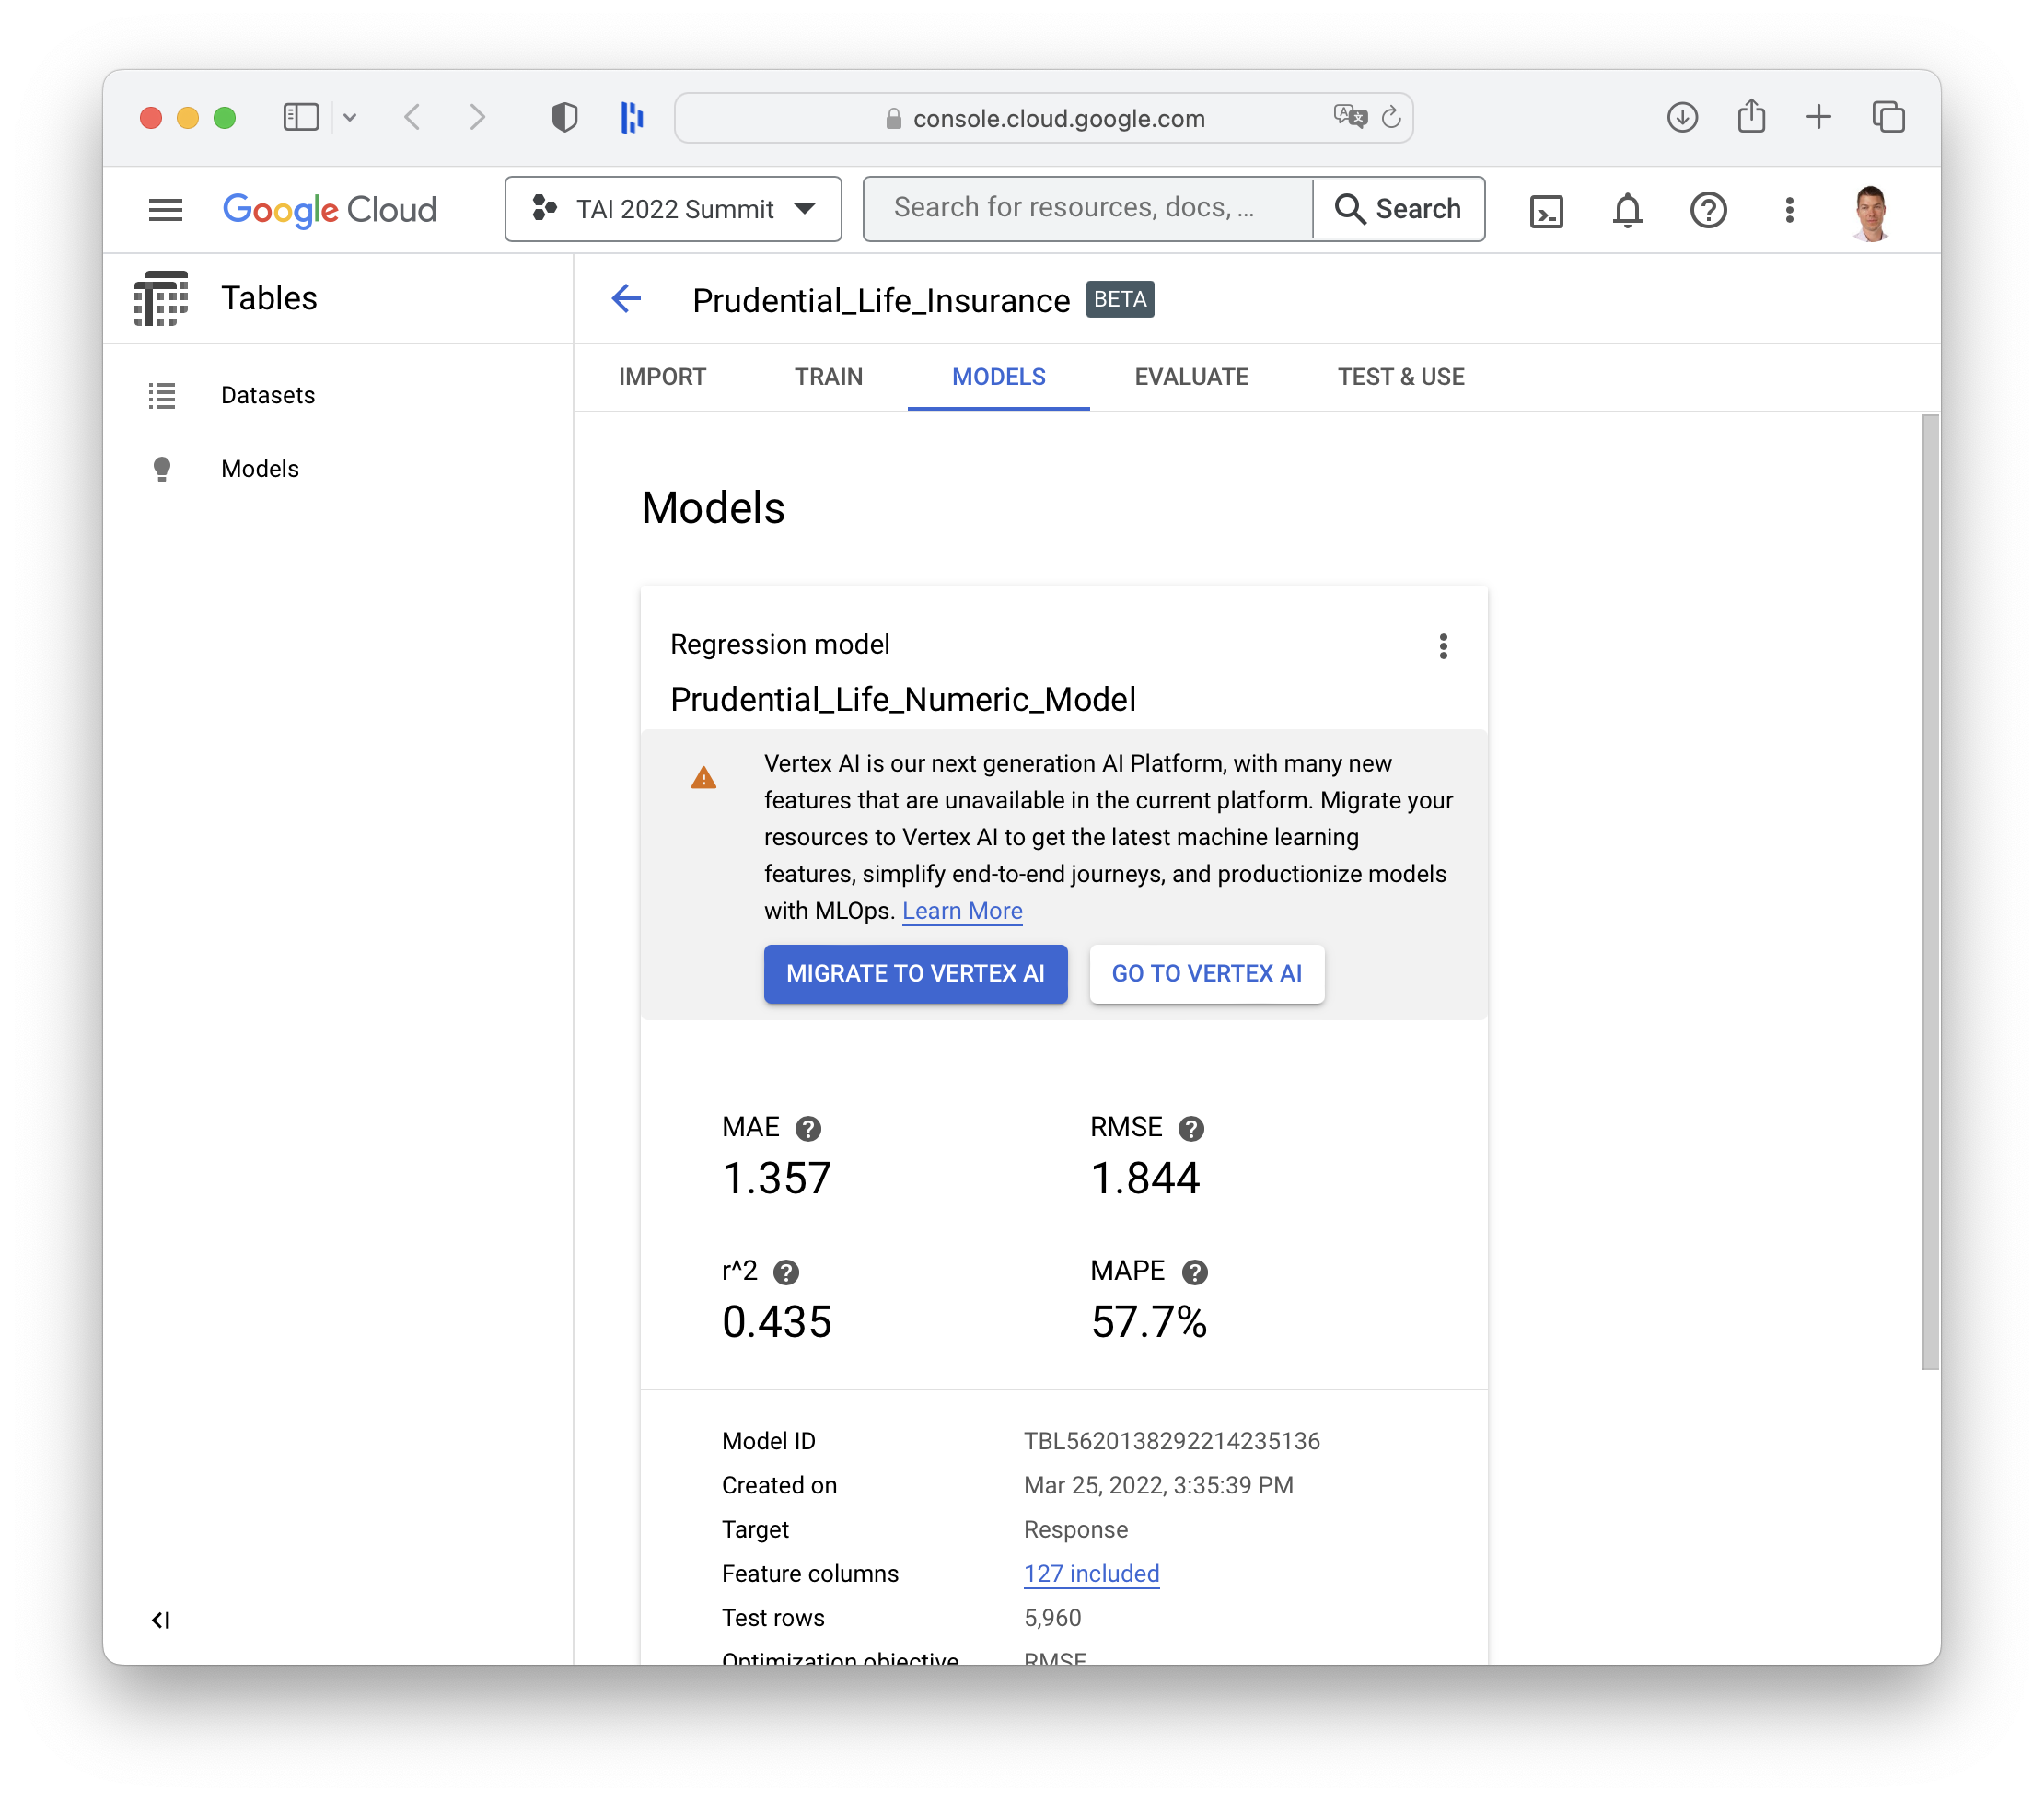
Google Cloud Platform has similar tools to SageMaker Canvas called GCP AutoML Tables, which is being rebranded to Vertex AI, but one important distinction is that the it does not seem to offer the ability to share the underlying model generated by the AutoML with a data scientist for review before putting the model to use in production.
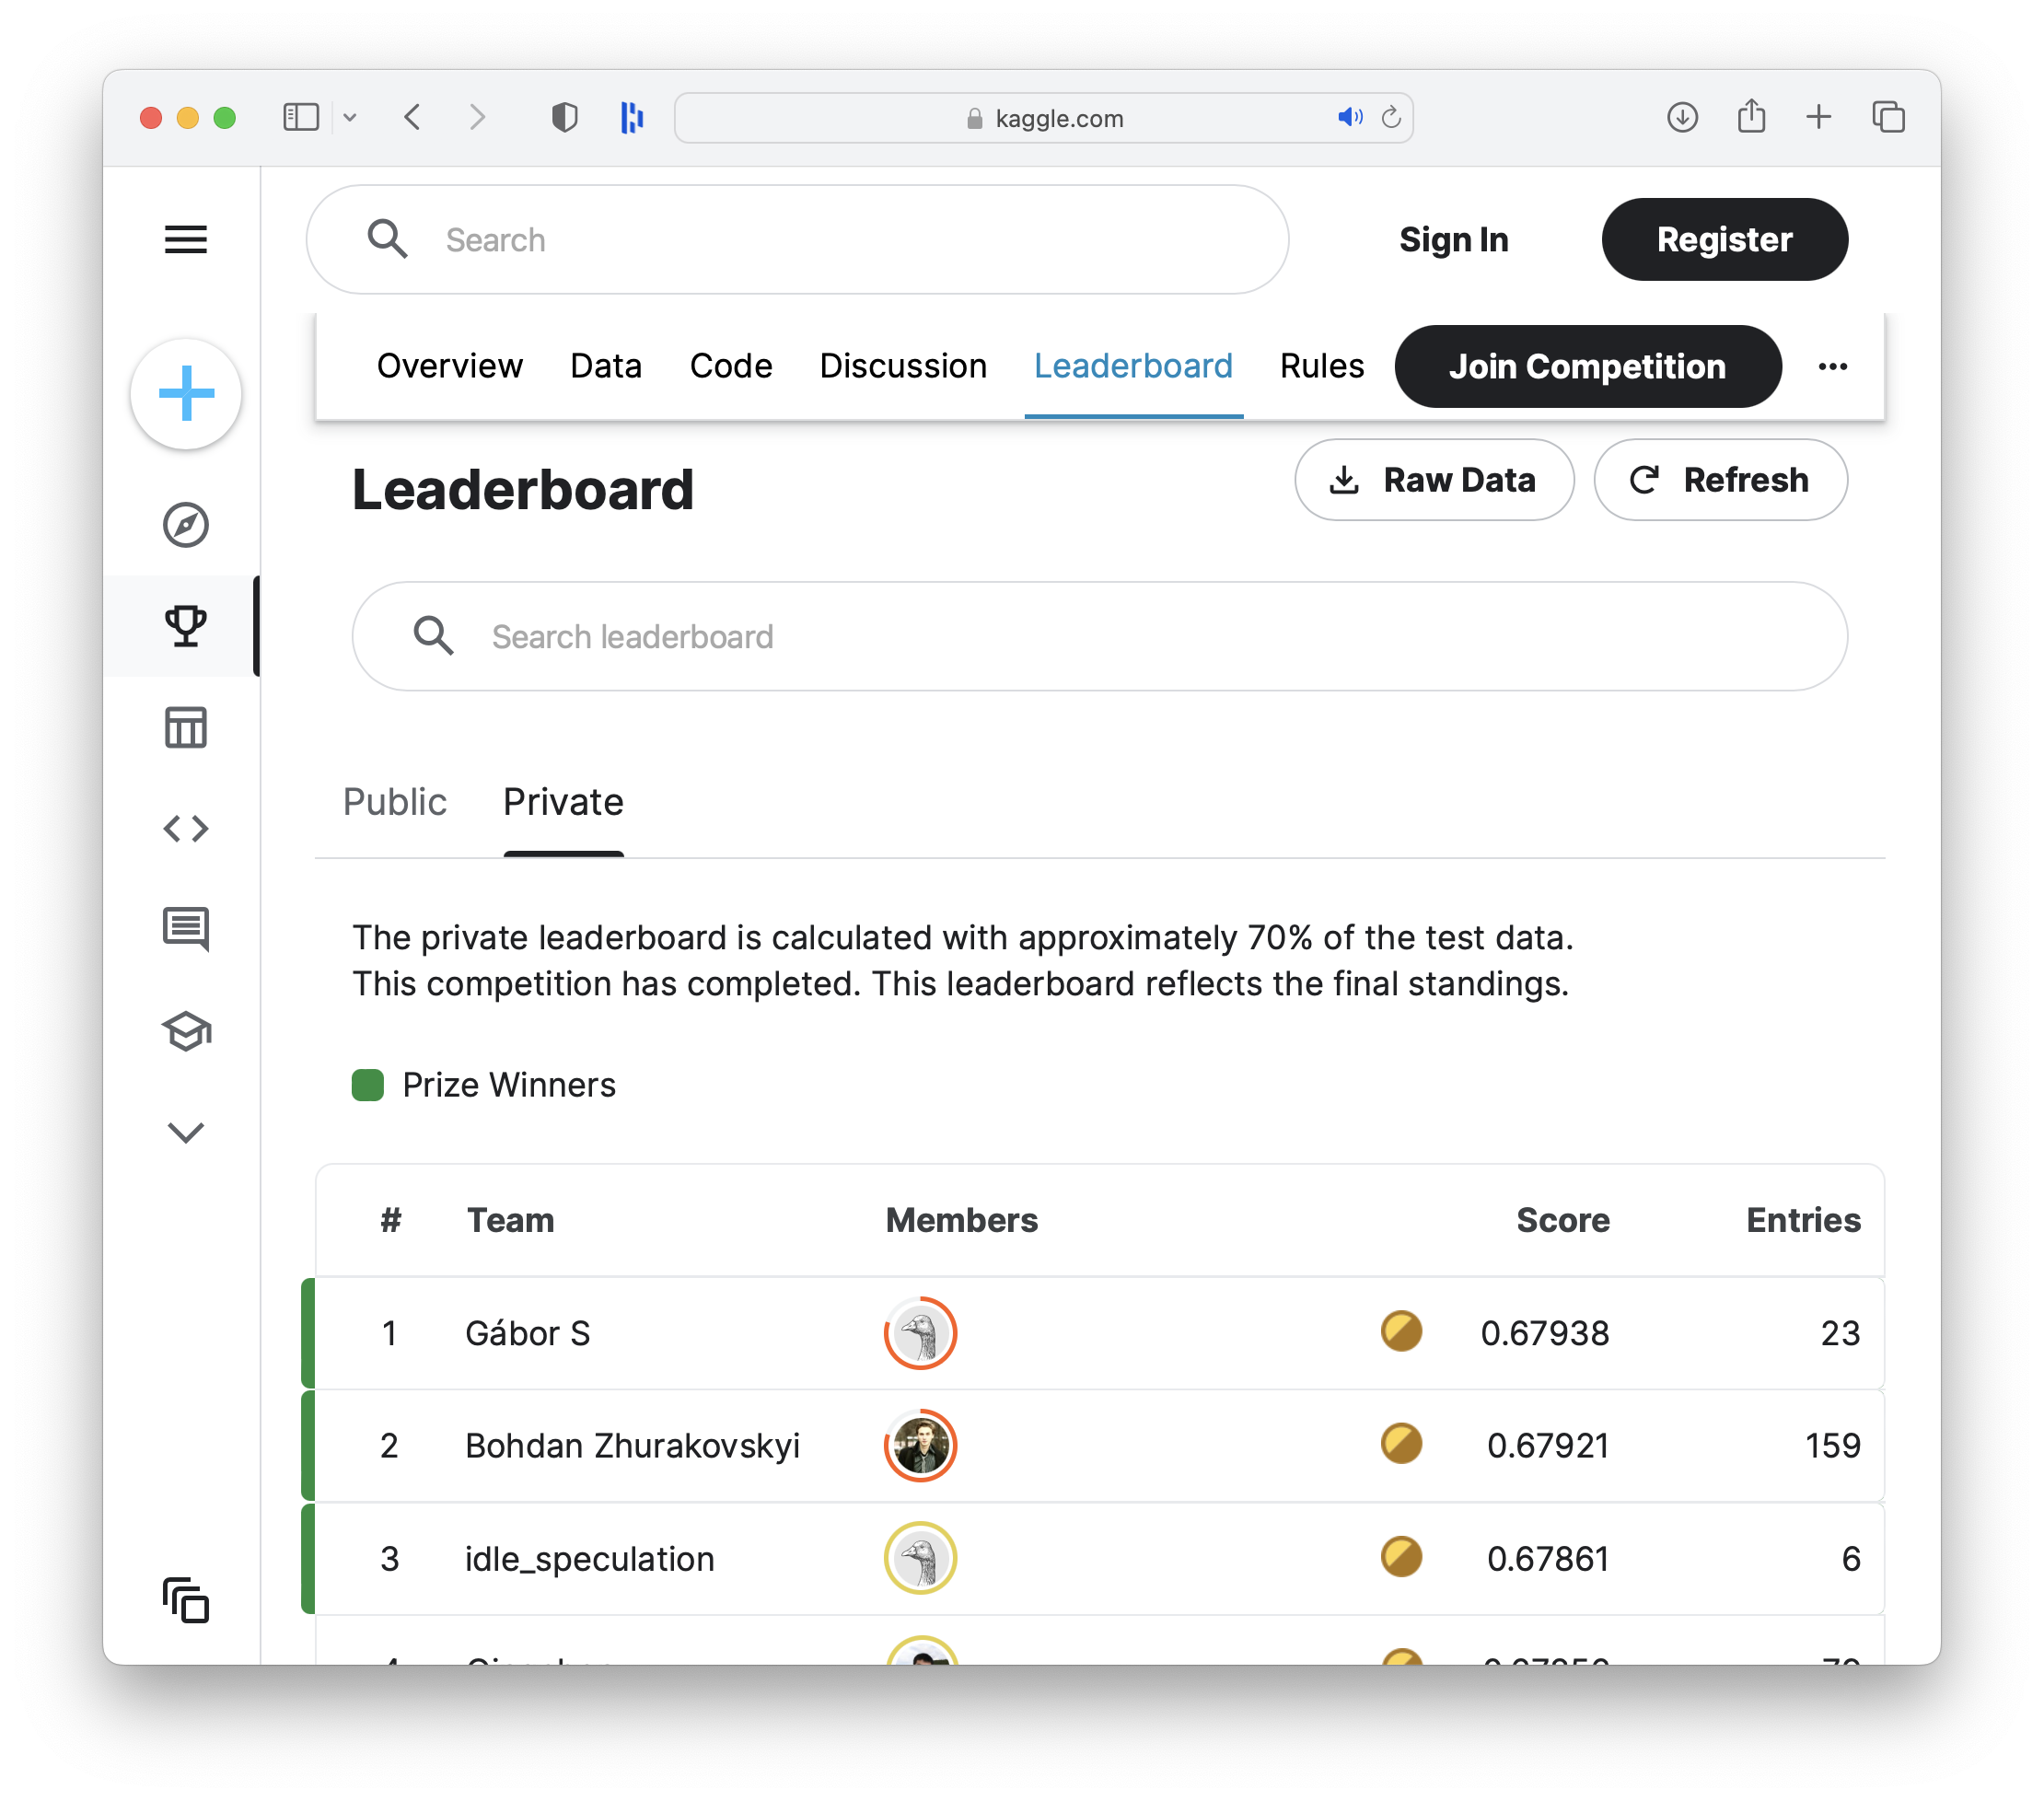
Competition Results
Crowd-sourced
0.679 accuracy
AutoML
0.621 accuracy
So when we first said we'd put AutoML up against thousands of crowd-sourced data science experts, did anyone expect these results?
- 2,563 data scientists, thousands of crowd-sourced hours: 0.679
- AutoML score: 0.621
Not bad for uploading a spreadsheet, pressing a button, and waiting a few hours.
What’s most exciting, isn’t necessarily the score. Thats because the difference between first place and 500th place can be as small as .001 of a percentage point. It’s more about a demonstration of the democratization of AI in a way that is more inclusive to all of the disciplines needed to bring a model to production. The win is really the tight feedback loop.
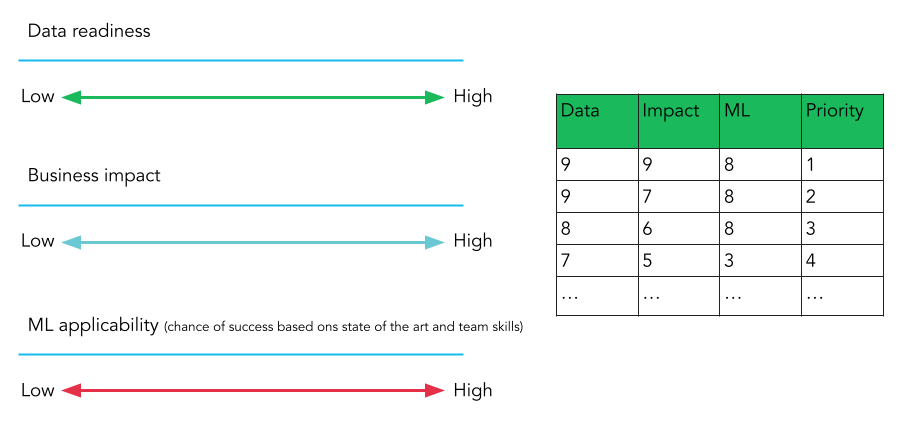
Also, we took this chicken or egg problem (to know if you have a good candidate for ML, you need to know if the project has ML applicability and our data is ready) and you got a rough answer in hours not months.
Plus, how great is it that we just got to hear a human data scientist say they really like the AutoML output because it even takes care of some of the tedious work they don’t like!
We are not advocating for publishing models straight from these next generation tools like Canvas. As the analogy goes for self-driving cars, you wanna keep your “Hands on the wheel”. Data scientists, ML Engineers, MLOps, and Model Governance will remain important for a variety of reasons, not the least of which is safety and ethics of our models.
But isn’t it amazing to see how far you can get from a rapid discovery perspective and get fully explainable ML predictions in just a few hours, and without any heavy ML lifting?
Where to Get Started
In covering the ML Project Prioritization rubriks, we discussed how to get started. And now we can talk about where to get started. Our three main recommendations for where to get started with using AI/ML are:
- Start small - With data that’s already sitting on your servers
- Tackle an existing business process - “What if we could improve this decision by x %, what effect would it have on our business?”
- Do your data scientists a solid - Run a little AutoML for them. They’ll appreciate you.
This approach is also supported by industry experts like Andrew Ng and Sam Altman:
Summary
In summary, we'll leave you with the following points
- AutoML is a way to jump start ML exploration of tabular & time series.
- The Democratization of ML is real. Now business / data / sales / marketing analysts can begin to generate ML predictions without ML expertise.
- You don’t have to wait for a full ML team to get started.
- If ML is on your roadmap, AutoML’s a fast way to prioritize your project (based on Data Readiness, ML applicability) and get started!
- If ML isn’t on your roadmap, then maybe it’s not as complicated as you might have thought.