Sharing Our Passion for Technology
& Continuous Learning

The featured company is a globally distributed organization. Prior to its consolidation, IT services were site specific, resulting in inconsistent services and expectations across locations. With IT consolidation, we brought together diverse groups with no common culture. IT needed to have standards and ownership put in place around process and measures to ensure they could keep up with the growing business needs. With this consolidation, the necessity for a focus on IT Service Management leveraging the Science of Quality tools such as Lean and Six Sigma, was born.
Many years ago, IT services originated to enable an employee computing environment. With growing capabilities around dealer and factory support, IT expanded from basic computing support to dealer critical applications and factory critical SAP support. Today, IT hosts applications that link customer equipment to automated services, making IT critical to the business. IT has grown from being just an internal IT support center to being integrated into the customer environment.
IT’s Service Management Architecture organization was created to establish an architecture we would leverage (ITIL) and a quality team to measure its success. This organization, which is responsible for our service management efforts as well as quality, needed to engineer a quality strategy and roadmap designed to make the organization easier to do business with. IT as an organization wanted to lead their services, people, and processes toward a focus on quality, alignment of retail and wholesale services, and delivery cycle time using metrics. This two-person organization leveraged the best practices from the business to create a model for the program based on proven systems. They put the focus of the IT teams on the quality of their products and services, their alignment to each other to deliver complete solutions as well as alignment to their customer, and cycle time to measure if they were improving on delivery time.
Phase 1: Laying the Foundation and Framework
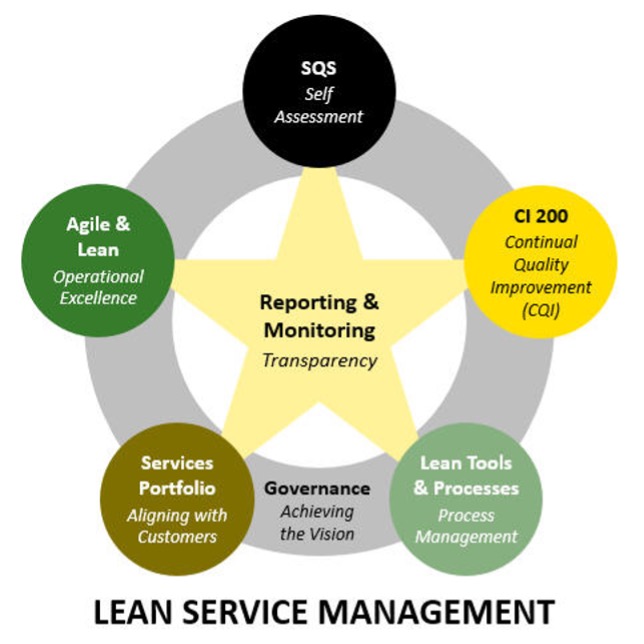
Lean Service Management is the name of the quality strategy program and is based on the foundation and framework that was rolled out in Phase 1. Leveraging ITIL as a standard for core processes, we identified a solid set of items to focus on in Phase 1. Each phase has a predetermined set of processes that will focus on based on an internal capability assessment, and each team established a baseline assessment of the key process areas chosen for Phase 1:
- Agile and Lean for operational excellence
- Services portfolio for aligning with customers
- Lean tools and processes for process management
- CI 200 (Continuous Improvement System) for continual quality improvement
- Governance for achieving the vision
- Reporting and monitoring for transparency
Over 70 teams, across six iterations of deployment, called Spirals, began their journey by utilizing the Software Quality System (SQS) to do a self-assessment. SQS is a Capability Maturity Model Integration (CMMI)-based assessment that allows teams to measure their capability/maturing for each process area. Since CMMI and ITIL align, these industry best practices were easy to integrate. We ended Phase 1 with a reassessment to measure the impact of what the teams learned during the implementation.
In Phase 1, the focus of the SQS assessment was on team level process areas, including, risk management, service system development, work planning, decision analysis and resolution, capacity and availability management, service delivery, configuration and change management, and incident resolution and prevention. Because we are using the factory scenario within operations, the process areas targeted for improvement were work planning (agile and lean) so we can document our alignment and work flows, and service delivery (service portfolio) so we could establish a system for measuring for cycle time. Leveraging the SQS results, Phase 2 targets for improvement were established.
The services portfolio exercise helped clarify the services and brought the vocabulary of our customers to our retail nd wholesale products and services. Leveraging the existing Quality System allowed us to establish capability and maturity metrics around things the business and our customers already understood. Leveraging best practices allowed the business to see that we were able to utilize what made them great to improve IT. These best practices included the continuous improvement process used in our factories, the quality system used in engineering and manufacturing, the enterprise agile efforts, the company University, and the Enterprise Design for Six Sigma program. All of these tools were already in use and in the language of our customers.
During Phase 1, to support reporting and monitoring, we established a IT quality dashboard to measure the lagging performance metrics that defined our product quality, delivery quality, and support quality, as well as our customer satisfaction scores.
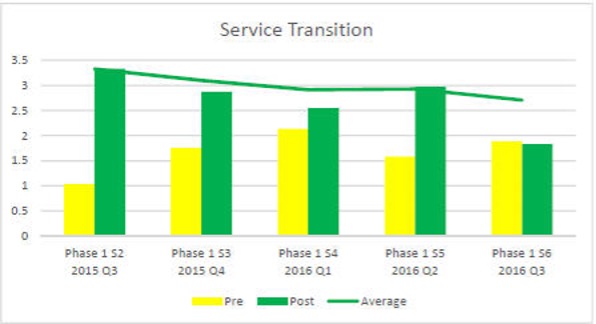
Analyzing the pre (yellow) and post (green) scores show that improvements in capability and maturity were made across the related process areas during every iteration/spiral. The scale ranges from 0, where something in the process is not done at all, to 5, where analysis and metrics help drive improvement of consistent process planning and execution. These scores also continue to provide information about where we still have the largest capability gaps as indicated by the score and are the input to our learning and phase building approach. We are defining the phases based on the analysis of the previous phase results. The foundation is the strategic elements of leadership. The bar chart shows an example of the service operations results, with a few key results:
- Every team that defined its service delivery felt it improved its maturity to deliver consistently
- The first three quarters were working with teams whose services were inter-related
The first teams (S2) learned from the program. Before we measured the baseline for the S3 teams they had learned from the S2 teams and therefore started off at a higher capability. When we executed S4 and the baseline score improved again, we knew we had succeeded at creating a program that supported sustainable learning. The S5 teams that represented a new set of services which inter-related to S6 again proved our theory. The data is still coming in from these teams, but our initial results are very promising.
Phase 2: Leveraging Organizational Learning
Phase 2 areas for improvement, which were derived from the Phase 1 SQS results, are capacity and availability management, configuration management, and service system development. Capacity planning models and templates, a service management process knowledge center, and a service catalog tool configuration and pilot are all driving capability and maturity improvements throughout IT.
During Phase 2, SQS assessments are being done at the service lane level, instead of at the team level, to support our organizational learning model with better efficiency. The ability to look at process capability at the service lane level allows us to measure our processes at the same level the customers do, enabling us to measure our alignment at that level. User experience, strategic service management, service continuity, supplier agreement management, information security management, service system transition, work monitoring and control, causal analysis, and resolution and access management are the process areas we measured. We expanded the focus beyond ITIL and CMMI to include the NIST supported categories of Access Management and Information Security Management.
Phase 3: Standardizing Key Processes
The target for improvement during Phase 3 will be the implementation of a common ITSM tool across Global IT. The goal is to eliminate the use of many different tools that impact our ability to share, communicate, automate, and generate common metrics. We will be implementing standard processes to support service management, incident management, change and release management, and problem management. Phase 4 will likely include the expansion of the tool for asset management, service catalog, and knowledge management.
During Phase 3, the SQS assessment will cover the key process areas around business relationship management and demand management, including financial management, asset management, release management, and change evaluation. Getting the baseline around these key process areas will support our future phases as well as measuring where our efforts have improved integrated process areas we have already targeted.
Phase 3 will be the biggest challenge of all and we are confident that we have prepared our organization for change and have developed a model that enables our continued growth across the teams, as a unified IT provider.
Encouraging Results
There are some key elements that allowed two people to lead a cultural transformation around the globe. First is the use of on-line training. This training empowered us to train the teams as a group and included all contract and contingent personnel. It also allowed us to track individual completion of the training elements for our “no person left behind” strategy. We knew if we wanted to change the culture, we would have to touch every contributor with Phase 1.
Second was the use of the spiral deployments. We covered 2000 employees worldwide in one year. Spiral 1 by definition is one team who verifies all the training materials and is coached by the program lead (Quality Manager). Spiral 2 is the early adopters who validate the materials and assure it scales to different team scenarios. This lab experiment is also coached by the Quality Manager. Spiral 3 is the first general admission spiral, and each team is coached by a team lead from a former spiral. This coaching model leads us to a self-perpetuating system. Spirals 4, 5, and 6 are also all voluntary for timing to suit the team schedule or alignment of related teams and services.
The final key element of our success is the post assessment. We know the motivation is high when each team is asking to participate in a spiral and is then anxious to do their reassessment at the end to find out how far they have come during their LSM journey. This model has lead us to our perpetuating, self-learning, self-organizing quality strategy and lean service management program.